| The learning algorithm
GeneXproTools 4.0 uses for
classification, classifies your input data into two classes: class "0" and class "1". Obviously, the dependent variable in your training and testing sets
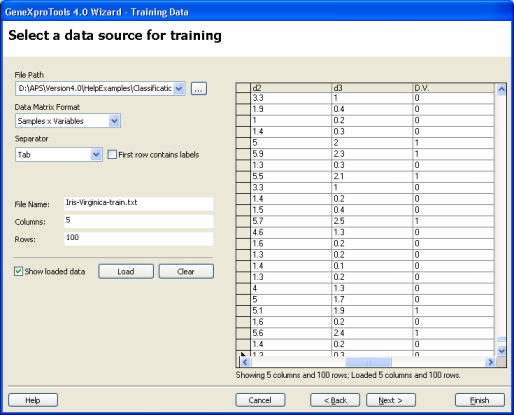
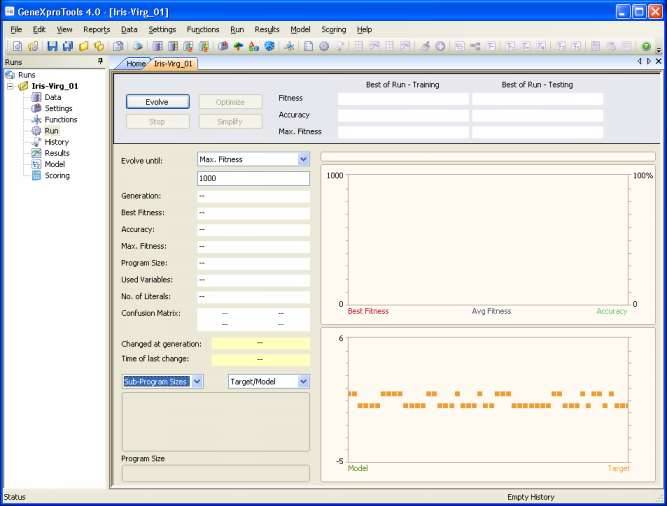
can only have two distinct values: 0 or 1. GeneXproTools 4.0 classifies the value returned by the evolved model as "1" or "0" using the 0/1 Rounding Threshold. If the value returned by the evolved model is equal to or greater than the rounding threshold, then the record is classified as "1", "0" otherwise. Classification problems with more than two classes are also easily solved with GeneXproTools 4.0. When you are classifying data into more than two classes, say, n distinct classes, you must decompose your problem into n separate 0/1 classification tasks as follows: C1 versus Not C1 C2 versus Not C2 ... Cn versus Not Cn Then evolve n different models separately and combine the different models to make the final classification model. But before evolving a model with GeneXproTools 4.0 you must first load the input data for the learning algorithm. GeneXproTools 4.0 allows you to work either with databases/Excel or text files and, for text files, accepts two different data matrix formats. The first is the standard Samples x Variables format where samples are in rows and variables in columns, with the dependent variable occupying the rightmost position. In the small example below with 10 samples, IRIS_PLANT is the class and SEPAL_LENGTH, SEPAL_WIDTH, PETAL_LENGTH, and PETAL_WIDTH are the independent variables or attributes: SEPAL_LENGTH SEPAL_WIDTH PETAL_LENGTH PETAL_WIDTH IRIS_PLANT 5.4 3.4 1.7 0.2 0 6.1 3.0 4.6 1.4 0 5.0 3.4 1.6 0.4 0 5.2 3.5 1.5 0.2 0 5.1 3.7 1.5 0.4 0 5.5 2.4 3.7 1.0 0 7.2 3.2 6.0 1.8 1 6.3 2.7 4.9 1.8 1 7.7 3.8 6.7 2.2 1 4.8 3.4 1.9 0.2 0 And the second, is the Gene Expression Matrix format commonly used in DNA microarrays studies where samples are in columns and variables in rows, with the class occupying the topmost position. For instance, in Gene Expression Matrix format, the small dataset above corresponds to: IRIS_PLANT 0 0 0 0 0 0 1 1 1 0 SEPAL_LENGTH 5.4 6.1 5.0 5.2 5.1 5.5 7.2 6.3 7.7 4.8 SEPAL_WIDTH 3.4 3.0 3.4 3.5 3.7 2.4 3.2 2.7 3.8 3.4 PETAL_LENGTH 1.7 4.6 1.6 1.5 1.5 3.7 6.0 4.9 6.7 1.9 PETAL_WIDTH 0.2 1.4 0.4 0.2 0.4 1.0 1.8 1.8 2.2 0.2 which is very handy for datasets with a relatively small number of samples and thousands of variables. Note, however, that for Excel files this format is not supported and if your data is kept in this format in Excel, you must copy it to a text file so that it can be loaded into GeneXproTools. GeneXproTools uses the Samples x Variables format throughout and therefore all formats are automatically converted and shown in this format. GeneXproTools supports the standard separators (space, tab, comma, semicolon, and pipe) and detects them automatically. The use of labels to identify your variables is optional and GeneXproTools also detects automatically whether they are present or not. If you use them, however, you will be able to generate more intelligible code where each variable is identified by its name, by checking the Use Labels box in the Model Panel.
To Load Input Data for Modeling
In data mining, be it performed by learning algorithms or conventional statistical methods, it really pays to take a good look at your data before embarking on a complex, usually time consuming modeling process. It's true that evolutionary algorithms are particularly well equipped to deal with noisy data, but the better the data you feed them the better the models they produce.
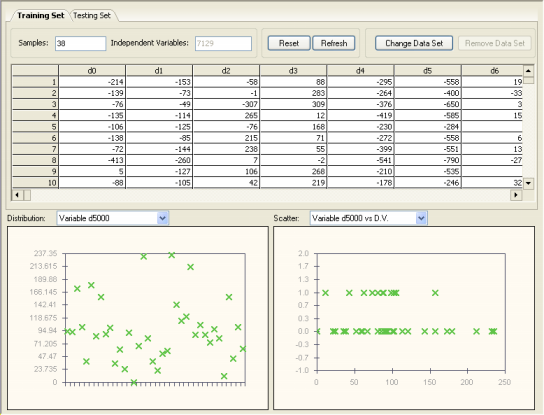
The graphical visualization tools of GeneXproTools 4.0 make it easy to identify outliers, which may well represent errors in the data files. After loading your data into GeneXproTools, in the Data Panel you can visualize the distribution of values for each variable and also plot each independent variable against the dependent variable.
|


