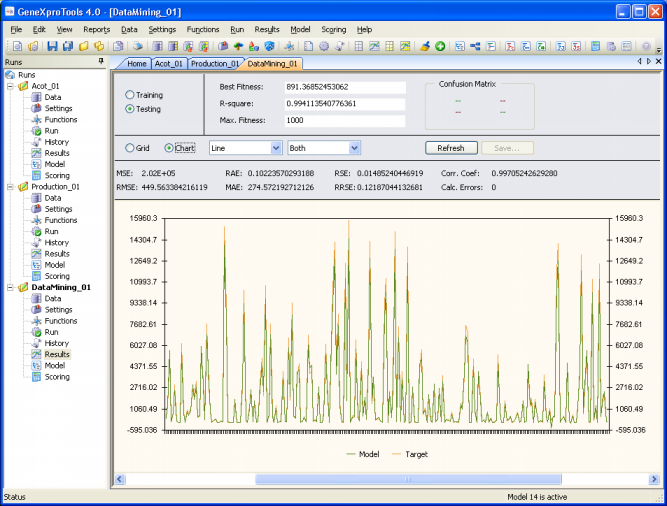
GeneXproTools 4.0 offers an extremely complete package of statistical tools which you can use to evaluate the accuracy of your models without leaving the
GeneXproTools modeling environment.
To Evaluate the Accuracy of a Model with GeneXproTools 4.0
- In the Run Panel, during a run, check the generation values of Best Fitness and
R-square/Accuracy.
For Function Finding and Time Series Prediction both the fitness and R-square of the best model of each generation are shown and plotted in a
chart during a run. For Classification and Logic Synthesis the
classification accuracy is shown instead.
- In the Run Panel, after a run, check the best-of-run values of Fitness and
R-square/Accuracy.
After a run, both the fitness and R-square/Accuracy of the best model discovered in the run are given both for the training and testing sets. Since the testing set is not used during training, the values of fitness and R-square/Accuracy on the testing set are a good indicator of the generalizing capabilities of your model.
- In the Results
Panel, check the values of additional statistical functions.
Depending on the problem category, a varied set of statistical evaluations of your model are shown to you while you are analyzing your new model. These statistics, performed both for the training and testing sets, include: mean squared error, root mean squared error, mean absolute error, relative squared error, root relative squared error, relative absolute error, correlation coefficient,
and R-square for all types of problem category; and the classification error, classification accuracy, confusion matrix (true positives, true negatives, false positives, and false negatives), sensitivity, specificity, positive predictive value, and negative predictive
value for Classification and Logic Synthesis.
- In the Report Panel, check the values of all the statistical functions performed by
GeneXproTools in the Results Panel for your active model.
Depending on the problem category, a varied set of statistical evaluations of your model are shown in the Report Panel. These statistics, performed both for the training and testing sets, include: mean squared error, root mean squared error, mean absolute error, relative squared error, root relative squared error, relative absolute error, correlation coefficient,
and R-square for all types of problem category; and the classification error, classification accuracy, confusion matrix (true positives, true negatives, false positives, and false negatives), sensitivity, specificity, positive predictive value, and negative predictive
value for Classification and Logic Synthesis.

|
|
