| APS 3.0 allows you to evaluate the accuracy of your models
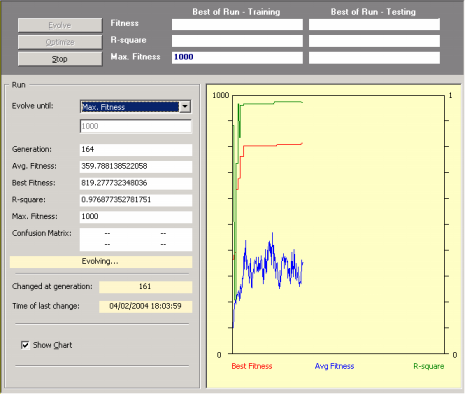
in the training set while they are still evolving. In the Run
Panel, during a run not only the fitness but also the
R-square of the best-of-generation model are plotted in a
chart so that you can stop the learning process whenever you see fit.
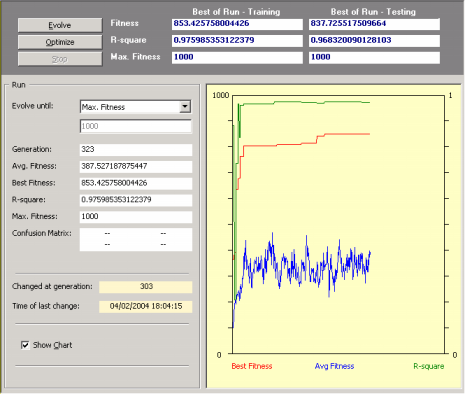
And after a run, still in the Run Panel, the fitness and R-square of the best-of-run model obtained on the testing set are also shown, giving you also a quick evaluation of the generalizing capabilities of your model.
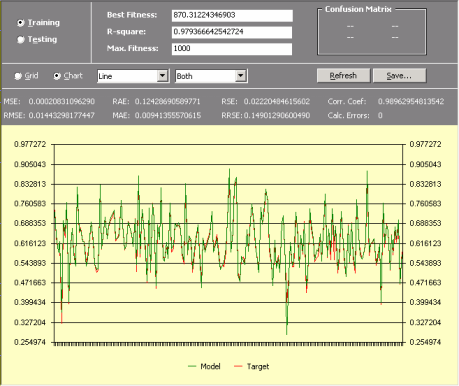
Then you can further evaluate your models in the Results Panel by comparing the output of your model with the target using both a spreadsheet and a chart for easy visualization.
In addition, while accessing your models visually in the Results Panel
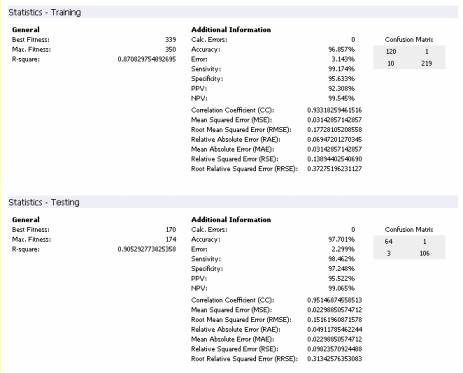
you can also check the results obtained for a wide set of
statistical functions both for the training and testing sets. You can save these statistical evaluations of your models and keep them in the
Report Panel for future reference.
|


