| The Transformed Time Series Tab gives access to the following
settings and features:
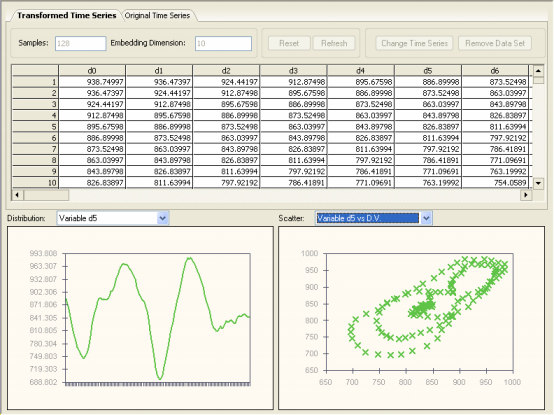
Samples
This box is informative only and shows the number of samples
used for training.
Embedding Dimension
This box is informative only and shows the embedding dimension (number of independent variables) used to create the training set.
Reset Button
Disabled in Time Series Prediction.
Refresh Button
Disabled in Time Series Prediction.
Change Time Series Button
Disabled in the Transformed Time Series Tab; you can only change
the time series from the Original Time Series Tab.
Remove Data Set Button
Disabled in Time Series Prediction.
Table
Shows all the variables in the training set. The entire table
can be copied to the clipboard by choosing Copy on the Edit Menu.
You can also copy selected columns to the clipboard with the mouse
right-click.
Distribution
Allows you to visualize the distribution of values for each variable in the training set.
This plot shows a maximum of 250 points at a time and, therefore,
for datasets with more than 250 samples you must move the scroll bar
on the right of the table and GeneXproTools will redraw the plot starting at
the first visible row. Then, by placing the cursor over the plot, GeneXproTools
shows you the range used to draw the plot. GeneXproTools allows
you to copy or print this plot through the mouse right-click.
Scatter
Allows you to visualize the scatter plot of each independent variable in the training set against the dependent variable.
This plot shows a maximum of 250 points at a time and, therefore,
for datasets with more than 250 samples you must move the scroll bar
on the right of the table and GeneXproTools will redraw the plot starting at
the first visible row. Then, by placing the cursor over the plot, GeneXproTools
shows you the range used to draw the plot. GeneXproTools allows you
to copy or print this plot through the mouse right-click.
|