|
The R-square returns the square of the Pearson product moment correlation coefficient,
which consists of a dimensionless index that ranges from -1 to 1 and reflects the extent of a linear relationship between two data sets.
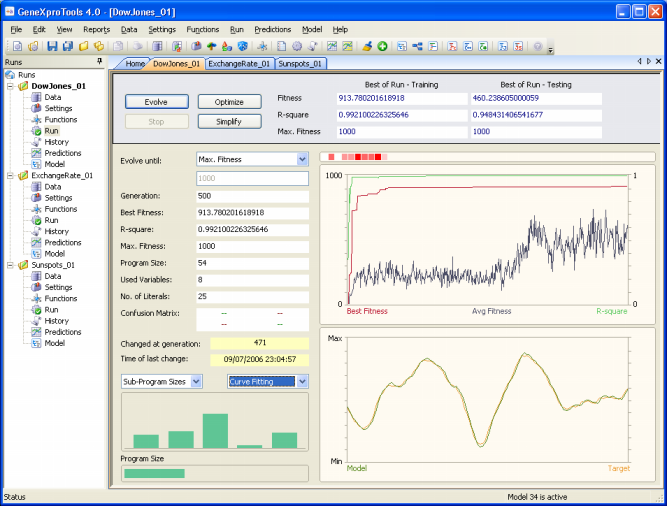
During a run, GeneXproTools updates continuously the R-square of the
evolving models and plots it in a chart in the Run
Panel.
The Pearson product moment correlation coefficient Ri of an individual program i is evaluated by the equation:
where P(ij) is the value predicted by the individual program
i for sample case j (out of n sample cases);
and Tj is the target value for sample case j.
|