| There are two main players in gene expression programming: the
chromosomes and the expression trees (ETs) or programs, being the latter the expression of the genetic information encoded in the former. As in nature, the process of information decoding is called
translation. And this translation implies obviously a kind of code and a set of rules. The
genetic code of gene expression programming is very simple: a one-to-one relationship between the symbols of the chromosome and the nodes they represent in the trees. The
rules are also very simple: they determine the spatial organization of nodes in the expression trees and the type of interaction between sub-ETs. Therefore, there are two languages in GEP: the language of the genes and the language of expression trees and, thanks to the simple rules that determine the structure of ETs and their interactions, it is possible to infer immediately the expression tree given the sequence of a gene, and vice versa. This means that one can choose to have a very complex program represented by its compact genome without losing in meaning. This unequivocal bilingual notation is called
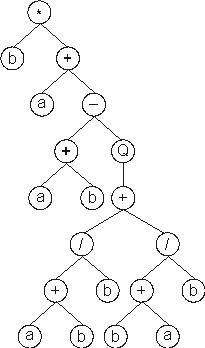
Karva language. Its details are explained in the remainder of this section. The structural organization of GEP genes is better understood in terms of open reading frames (ORFs). In biology, an ORF or coding sequence of a gene begins with the start codon, continues with the amino acid codons, and ends at a termination codon. However, a gene is more than the respective ORF, with sequences upstream of the start codon and sequences downstream of the stop codon. Although in GEP the start site is always the first position of a gene, the termination point does not always coincide with the last position of a gene. Consequently, it is common for GEP genes to have noncoding regions downstream of the termination point. These noncoding regions obviously do not interfere with expression but, nonetheless, they play a crucial role in evolution, for they alone allow the creation of valid programs no matter how profoundly their chromosomes are modified. Well get back to them later. Consider, for example, the algebraic expression:
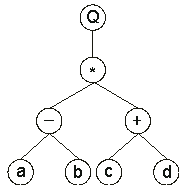
It can also be represented as a diagram or an expression tree:
where Q represents the square root function. 01234567 which is the straightforward reading of the expression tree from left to right and from top to bottom (exactly as we read a page of text). The expression (2) is an ORF, starting at Q (position 0) and terminating at d (position 7). These ORFs were named
K-expressions from Karva language. 01234567890 Its expression as an ET is also very simple and straightforward. In order to express the ORF correctly, we must follow the rules governing the spatial distribution of functions and terminals. First, the start of a gene corresponds to the root of the ET which is placed in the topmost line. Second, in the next line, below each function, are placed as many branch nodes as there are arguments to that function. Third, from left to right, the nodes are filled consecutively with the next elements of the K-expression. Fourth, the process is repeated until a line containing only terminals is formed. In this case, the following expression tree is formed:
Looking at the structure of GEP ORFs only, it is difficult or even impossible to see the advantages of such a representation, except perhaps for its simplicity and elegance. However, when
ORFs are analyzed in the context of a gene, the advantages of this representation become obvious. As previously stated, GEP chromosomes have fixed length, and they are composed of one or more genes of equal length. Consequently, the length of a gene is also fixed. Thus, in gene expression programming, what varies is not the length of genes which is constant, but the length of the
ORFs. Indeed, the length of an
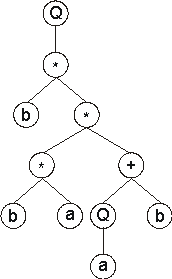
ORF may be equal to or less than the length of the gene. In the first case, the termination point coincides with the end of the gene, and in the latter, the termination point is somewhere upstream of the end of the gene. t = h (n-1) + 1 Consider a gene for which the set of functions F = {Q, *, /, -, +} and the set of terminals T = {a, b}. In this case n = 2; if we chose an h = 15, then t = 15 (2 - 1) + 1 = 16; thus, the length of the gene g is 15 + 16 = 31. One such gene is shown below (the head is shown in blue): 0123456789012345678901234567890 It codes for the following ET:
In this case, the K-expression ends at position 7, whereas the gene ends at position
30. 0123456789012345678901234567890 And its expression gives:
In this case, the termination point shifts one position to the right (position
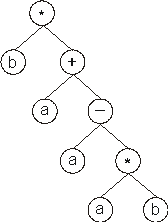
8), changing slightly the daughter tree. 0123456789012345678901234567890 And its expression gives:
In this case, the termination point shifts twelve positions to the right (position
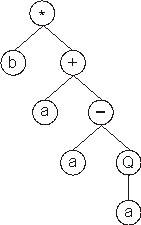
19), enlarging and changing significantly the daughter tree. 0123456789012345678901234567890 Its expression results in the following ET:
In this case, the ORF ends at position 3, shortening the original ET in
four nodes. |
