| The Transformed Time Series Tab gives access to the following
settings and features:
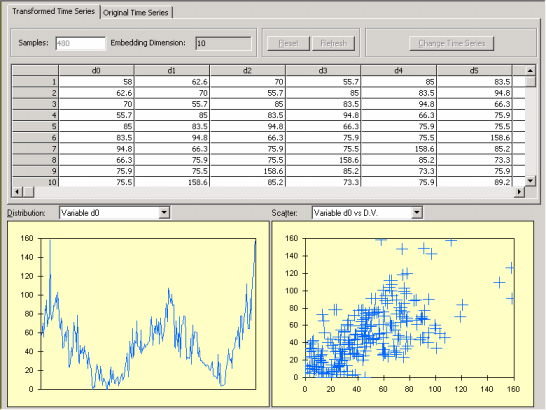
Samples
This box is informative only and shows the number of samples
used for training.
Embedding Dimension
This box is informative only and shows the embedding dimension (number of independent variables) used to create the training set.
Distribution
Allows you to visualize the distribution of values for each
variable in the training set. This plot shows a maximum of 250
points at a time and, therefore, for datasets with more than 250
samples you must move the scroll bar on the right of the table and
APS will redraw the plot starting at the first visible row. Then, by
placing the cursor over the plot, APS shows you the range used to
draw the plot.
Scatter
Allows you to visualize the scatter plot of each independent
variable in the training set against the dependent variable. This
plot shows a maximum of 250 points at a time and, therefore, for
datasets with more than 250 samples you must move the scroll bar on
the right of the table and APS will redraw the plot starting at the
first visible row. Then, by placing the cursor over the plot, APS
shows you the range used to draw the plot.
|