| The Run Panel gives access to the following settings
and features:
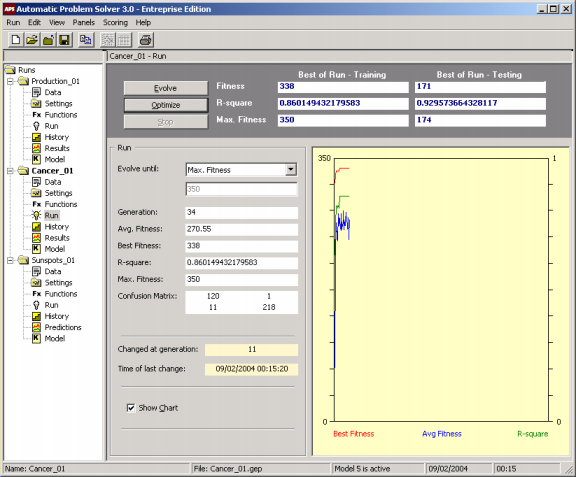
Evolve
Starts the evolutionary process from scratch, that is, from a completely random initial population.
Optimize
Starts the evolutionary process with a seed
model, using it to breed better models.
Stop
Stops the evolutionary process.
Best of Run – Training
Under this heading are shown the values of Fitness,
R-square, and Max. Fitness obtained on the training set for the best model of each run. These values are only updated at the end of each run or between
Complexity Increase cycles. They are also updated if some relevant setting is changed, say, a different fitness function, a different training set, or a different model, and if the model is afterwards processed in the Results Panel.
Best of Run – Testing
Under this heading are shown the values of Fitness,
R-square, and Max. Fitness obtained on the testing set for the best model of each run. These values are only updated at the end of each run or between
Complexity Increase cycles. They are also updated if some relevant setting is changed, say, a different fitness function, a different testing set, or a different model, and if the model is afterwards processed in the Results Panel. If no testing set is used, a dash is shown in all the boxes.
Evolve Until
Sets the stop condition. This stop condition is formulated using two different boxes. In the first you choose the stop condition and, in the second, you set the value for the chosen condition. There are four different stop conditions to choose from. The first allows you to evolve models for a certain number of
generations. In this case, you must write in the box underneath the number of generations you want. The second allows you to evolve models until the best fitness is equal to or higher than a certain value. In this case, you must write in the box underneath this fitness value. The third allows you to evolve models until the
R-square of the best model is equal to or higher than a certain value. In this case, you must write in the box underneath this R-square value. Obviously, only values higher than 0 and equal to or less than 1 are valid, and if an invalid value is used APS uses the value of 1 by default. The fourth allows you to evolve models until the best fitness is equal to maximum fitness. In this case, the correct value of maximum fitness is automatically introduced by APS in the box underneath.
Generation
Updates the generation number throughout a run.
Avg. Fitness
Updates the average fitness of the population throughout a run.
Best Fitness
Updates the best fitness of each generation throughout a run.
R-square
Updates the R-square
of each generation throughout a run.
Max. Fitness
Shows the value of maximum fitness for the current run.
Confusion Matrix
Shows the confusion
matrix, where true positives followed by
false negatives are shown on the first row, and
false positives followed by
true negatives are shown on the second row.
Changed at Generation
Updates, throughout a run, the number of the generation at which a change in best fitness occurred.
Time of Last Change
Updates, throughout a run, the time when a change in best fitness occurred.
Show Chart
Check this box if you want to follow the evolutionary process graphically. The chart plots the best fitness and the
R-square of the best model of each generation. It also plots, each generation, the average fitness of the population so that you can observe the evolutionary dynamics of the population. The Y axis on the left refers to best and average fitness, whereas the Y axis on the right refers to the
R-square. The X axis corresponds obviously to the number of generations, with a complete screen spanning a total of 500 generations.
|