| The correlation coefficient Ci of an individual program
i is evaluated by the equation:
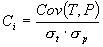
where Cov(T,P) is the covariance of the target and model outputs; and
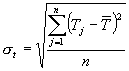
st and sp are the corresponding
standard deviations, which are given by:
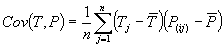
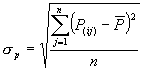
where P(ij) is the value predicted by the individual program
i for sample case j (out of n sample cases);
Tj is the target value for sample case j; and and and are given by the
formulas: are given by the
formulas:


The correlation coefficient is confined to the range [-1, 1]. When
Ci = 1, there is a perfect positive linear correlation between
T and P, that is, they vary by the same amount. When Ci = -1, there is a perfect negative linear correlation between
T and P, that is, they vary in opposite ways (when T increases,
P decreases by the same amount). When Ci = 0, there is no correlation between
T and P. Intermediate values describe partial correlations and the closer to 1 or -1 the better the model.
|