In gene expression programming, user defined functions (UDFs) may represent functions of several variables although their arity in terms of
expression rules is equal to zero. That is, nodes with UDFs behave as leaf
or terminal nodes. So, the implementation of UDFs in gene expression
programming can be done using at least two different methods: either they are treated as terminals and are used both in the
heads and tails or they are treated as functions and are used exclusively in the
heads. Either way, the algorithm works very well. Thus, it is a matter of taste which one to choose. In APS 3.0 the latter is used as it seems more consistent and less confusing.
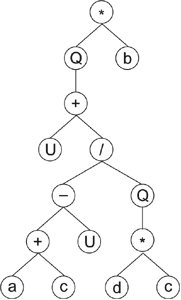
Let’s see now how genes containing UDFs are expressed. Consider, for instance, the gene below with a head size of
11 (the head is shown in blue):
01234567890123456789012
*Qb+U/-Q+U*acdcbbaaabcc
where “U” represents a UDF and “Q” represents the square
root function. Its expression results in the following
expression tree (ET):

This UDF “U” could represent any function, for instance, the logistic function
1/(1+e-x) or the power function xy or whatever function
one wishes to design. The difference between a UDF and a normal function
(any function from the 70 built-in
functions of APS 3.0 or DDFs)
is that the arguments to the UDF are fixed during the definition of the function whereas the arguments to the normal function are flexible and depend on the particular configuration of the expression tree. Suppose, for instance, that in the chromosome above, the UDF “U” represents
a particular square root function, more precisely
 . It’s worth comparing this fixed square root function with the normal, flexible square root function. For instance, in the program above, the square root function at position 7 corresponds to . It’s worth comparing this fixed square root function with the normal, flexible square root function. For instance, in the program above, the square root function at position 7 corresponds to  , whereas the “Q” at position 1 corresponds to
  .
.
However, despite their rigidity, UDFs are extremely useful, especially
when they are carefully crafted to the problem at hand. For that, a certain amount of inside knowledge about the data is obviously necessary and with
the data
visualization tools of APS 3.0 you can easily find important relationships between your variables and explore them to create useful UDFs that can be used to design highly sophisticated models.
|