By selecting the Training option on the Results
Panel, you can analyze the performance of your model in the training set.
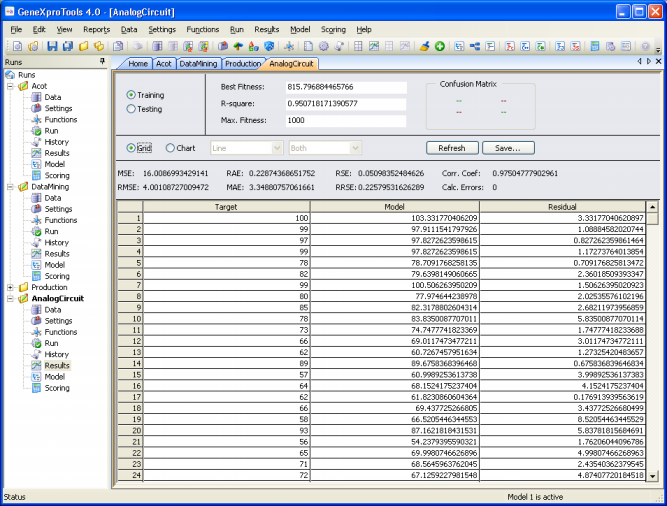
GeneXproTools 4.0 offers two different ways of analyzing and comparing the output of your model with the actual or target values
on the training set.
In the first, the target or actual values are listed in a spreadsheet
side by side with the predicted
or model values.
In the second, the target and predicted values are plotted in a
Curve Fitting or Target/Model chart for easy visualization. By moving the scroll bar
in the bottom, you can see the results for the entire dataset.
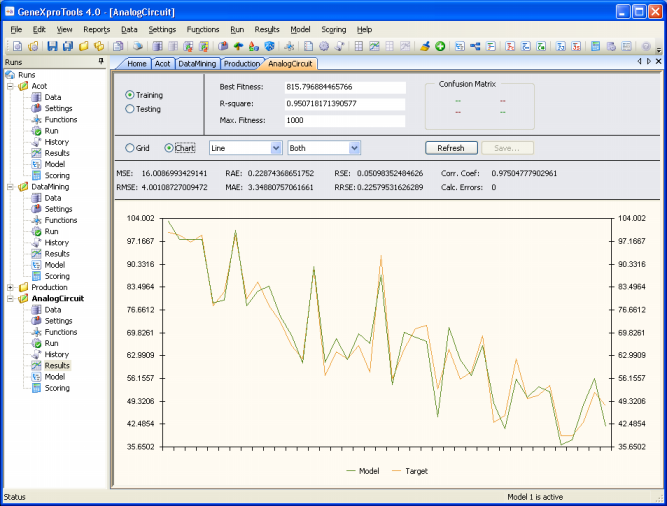
The charts of GeneXproTools 4.0 come in various flavors, and you can choose Line, Area, 3D Line, and 3D Area for analyzing your model. You can also choose to plot only the output of your model or the target values.
The 3D charts can be moved around for a different perspective by pressing Ctrl and dragging it with the mouse.
Additionally, GeneXproTools 4.0 performs on the fly an extremely complete statistical analysis of your model for the training set, including mean squared error, root mean squared error, mean absolute error, relative squared error, root relative squared error, relative absolute error, correlation coefficient, and R-square for Function
Finding and Time Series Prediction; and classification error, classification accuracy, confusion matrix (true positives, true negatives, false positives, and false negatives), sensitivity, specificity, positive predictive value, negative predictive value,
correlation coefficient, and R-square for Classification and Logic
Synthesis.
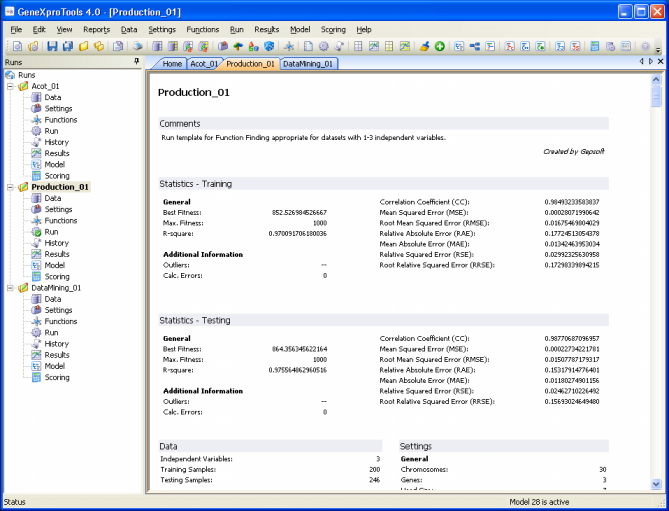
The output of all these statistical functions is conveniently shown in the Results
Panel for a quick evaluation during the modeling process and are also shown,
together with other indicators, in the
Report Panel for future reference.
|