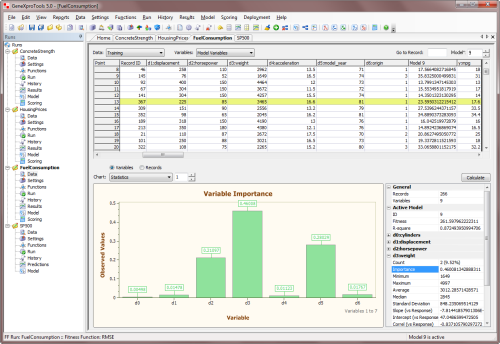
The importance of each variable in a model (what we call Variable Importance) is evaluated and shown in the Data Panel, both in the Statistics Report and in the Variable Importance Chart:
Because of its centrality in model assessment and analysis, we are making the Variable Importance Chart more accessible both through an icon and menu shortcuts. So now, instead of having to go to the Data Panel, then selecting "Model Variables" on top and then selecting "Statistics" in the charts on the bottom in order to access the Variable Importance Chart, you can just click the new icon (the Gold Bars icon) to take you directly to the Variable Importance Chart of the active model.
We've implemented this new feature for all modeling categories (Regression, Classification, Logistic Regression, Time Series Prediction, and Logic Synthesis) with both the new icon and menu shortcuts both in the Data Menu and Results/Predictions Menu. This new feature is part of the new mini-release "New Project: Cross-Validation, Var Importance & More" and will be launched shortly with GeneXproTools 5.0 MR2.


Comments
There are currently no comments on this article.
Comment
your_ip_is_blacklisted_by sbl.spamhaus.org