Home About Us Contact Blog
 
 
What's New Products Buy Now Downloads Forum  


Discover the excitement & power of modeling with GeneXproTools!
Create powerful predictive models for Regression & Time Series Prediction,
Classification & Logistic Regression and explore Logic Synthesis.

Learn More


GeneXproTools  

GeneXproServer  

Gene Expression Programming

 
What’s New in GeneXproTools 4.3?

With this release we are introducing new visualization tools, including a Classification Tapestry for model visualization during the design process and Binomial Fit Charts for visualization of Logistic Regression Models.

We are also adding new possibilities with the deployment of models to Excel that will save you the time and resources of dealing with the model source code. In addition to Model Deployment to Excel, we are also introducing the deployment of ensemble models to Excel, with the automatic generation of the Majority Vote Model for Classification and Logistic Regression, and the Average and Median Models for Function Finding and Time Series Prediction.

Another important aspect of this release is the introduction of new Fitness Functions for exploring the solution space more efficiently, creating better classifiers with wider margins and better generalization.

Also worth pointing out are the new capabilities for multiple unattended runs and the extensive Model Management Tools for selecting and keeping only the models of interest.

Below is a more detailed list of the new features. You can also watch a video introducing some of the new features in Logistic Regression & Classification.
 

New Visualization Tools

New charts both for real-time visualization of model design in the Run Panel and detailed model analysis in the Results Panel.

Classification Tapestry

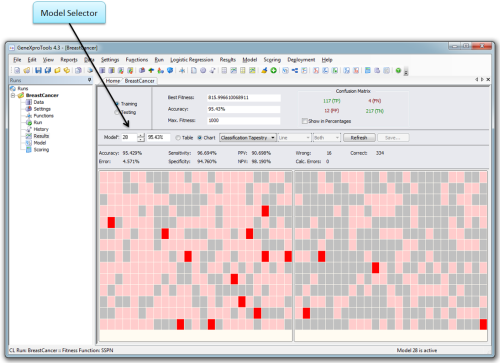
A Gepsoft's creation, the Classification Tapestry is a beautiful and simple visualization tool for analyzing classifiers at a glance. It uses a double, positive/negative checker board pattern to show the negative cases on the left side and positive on the right. Then on each side, the correct classifications are shown in light pink whereas the wrong ones are shown in bright red, thus unambiguously revealing all the elements of the Confusion Matrix.


You have access to the Classification Tapestry during model evolution in the Run Panel and in the Results Panel.


Binomial Fit Charts

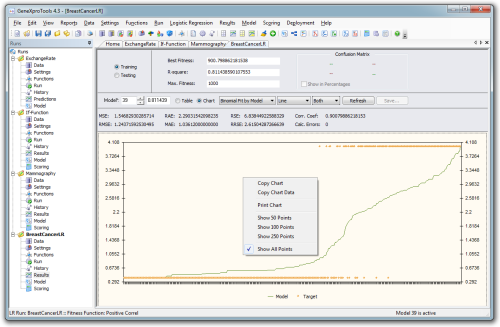
Logistic Regression becomes more integrated in version 4.3 with new Binomial Fit Charts for model evaluation both during the run and in the Results Panel.


Sorted Line Charts

Alongside the original Curve Fitting Chart of Function Finding, you now have access to Sorted Line Charts that show much more clearly how evolution is modeling your data.


And because they are less cluttered, these new charts have also the great advantage of allowing the visualization of many more points in the Run Panel. Now GeneXproTools shows a sorted batch of up to 1000 points in the Run Panel whereas in the Results Panel you can visualize up to 10000 points in a single screen with the possibility of scrolling through the entire dataset.


Model Deployment to Excel

Now in version 4.3 you can automatically export or deploy to Excel any model created with GeneXproTools without intervention from IT. Thanks to the new special-purpose VBA grammar of GeneXproTools the complete code of your models, including your Logistic Regression models, becomes readily accessible without a need for a software developer.

Excel worksheet with deployed model embedded.

The Excel workbook includes not only the results obtained both for the training set and the testing set used to create the model, but also a scoring worksheet that can be used to apply the model immediately to new cases.

Training Excel worksheet with deployed model.

Scoring Excel worksheet with deployed model.

In Time Series Prediction, Model Deployment to Excel includes iterative predictions to forecast future events.

Making predictions in Excel with Time Series data.


Ensemble Deployment to Excel

In addition to the deployment of individual models to Excel, you can now deploy complex model ensembles to Excel without any fuss. For regression models (both Function Finding and Time Series Prediction models), the ensemble Excel workbook includes the average multi-model (Average Model) and the median multi-model (Median Model). For Logistic Regression and Classification models, the majority vote multi-model (Majority Model) is automatically computed.


Also important is the option of exporting the raw output of the logistic regression models for creating richer derived features.

The number of models you can deploy automatically to Excel to form an ensemble depends on your edition of GeneXproTools, with unlimited models in the Enterprise Edition, 101 models in the Professional Edition, 51 in the Advanced Edition, and 11 in the Standard Edition.

Note that for this feature to work you have to enable it in Excel. Visit the step by step instructions here.


Extensive Model Management Tools

GeneXproTools is prodigal at generating good quality models. So we've added comprehensive Model Management Tools for selecting, keeping and combining only the models of interest. These new tools include combining models from different modeling sessions, deleting and keeping selected models, importing models from different gep runs, and also the possibility of generating an unlimited number of unattended runs or modeling experiments.


These new Model Management Tools are essential not only for helping you choose the very best model but also to help you choose good combinations of models for creating more powerful model ensembles.


New Fitness Functions

Fitness functions are the driving force behind search, guiding the search algorithm through different regions of the solution space. The new fitness functions we've added were cleverly designed to give you more control over the design quality of your models.

Fitness Functions for Classification

In Classification we've introduced new fitness functions and redesigned old ones in order to optimize the classifier margins. So now you will be able to choose the classifier with better generalization from a pool of different classifiers with similar classification accuracies. The new fitness functions that optimize the classifier margins are:

  • Dual Margin Fitness Function
  • Margin with Penalty
  • Positive Correlation
  • Bounded Positive Correlation
  • Enhanced Mean Squared Error
  • Enhanced Mean Absolute Error
  • Enhanced Relative Squared Error
  • Enhanced Relative Absolute Error

For the first two fitness functions, Dual Margin and Margin with Penalty, you can specify the margins through adjustable parameters. The defaults we've set are tailored to work efficiently on all kinds of problems and they vary according to the number of variables in your data.


However these defaults are just a guide to help you choose good margins or finding the best separating hyperplane (although, to be more precise, we should say hypersurface). The remaining fitness functions work the margins of the classifiers intrinsically as they measure different kinds of distance to the separating hyperplane. Just by combining this distance with the effective classifier hits, we were able to improve considerably the search capabilities of most fitness functions. Just as an example, the old R-square Fitness Function worked by rounding the model output first and then evaluating the R-square between the rounded model output and the target (the class attribute). Now it works by evaluating the R-square (just the positive correlations) between the raw model output and the target. Then by combining the search for better and better positive correlations with the number of hits (the number of effective correct classifications after the rounding of the model output), we have a radically different fitness function that is constantly working on improving the margins of the classifiers. The same design principle was followed for all the margin optimizers listed above.

Now for the simpler, hits-based fitness functions (Hits with Reward/Punishment & Cost/Gain Matrix fitness functions), we've transformed them completely by either combining them with rewards/punishments for correct/wrong classifications or computing the cost/gain matrix for the four different types of classifications (true positives, true negatives, false positives, and false negatives). In both cases, the reward/punishment and the cost/gain matrix are adjustable parameters, also preset with useful defaults.


As an example, take a look at the JavaScript code for the Hits with Reward/Punishment fitness function. This code can be used straightaway as Custom Fitness Function in GeneXproTools.

And finally, we've also added two totally new fitness functions based on the Entropy and Purity of the classifier:

  • Entropy Fitness Function
  • Purity Fitness Function

Fitness Functions for Logistic Regression

Working the margins is something that is smoothly and naturally done by good logistic regression optimizers. Indeed, how search is orchestrated in Logistic Regression inspired us to design the new margin optimization fitness functions in Classification. And for Logistic Regression we tried to design new fitness functions that included the best qualities of the Correlation Coefficient Fitness Function, by far the most efficient fitness function for Logistic Regression. So now, in version 4.3, we have the old R-square Fitness Function that continues to explore the correlation between the raw model output and the target, but we also have two new correlation-based fitness functions that allow for the design of more elegant and robust logistic models:

  • Positive Correlation Fitness Function
  • Bounded Positive Correlation Fitness Function

In addition, the new series of Enhanced Fitness Functions was created by combining bounded positive correlations with different kinds of error measures:

  • Enhanced Mean Squared Error
  • Enhanced Mean Absolute Error
  • Enhanced Relative Squared Error
  • Enhanced Relative Absolute Error

These new fitness functions optimize multiple objectives at the same time, and the result is a different kind of logistic regression model: certainly more elegant, perhaps more robust and easier to understand.

And finally, the old fitness functions based on the Selection Range and Precision (which are also some kind of margin), were also improved and now also come with preset defaults specially tailored for Logistic Regression.


Fitness Functions for Regression (Function Finding & Time Series Prediction)

In regression, the target or response variable is continuous and this, obviously, puts a different kind of constraint in the search. And if the methods used are the canonical Logistic Regression or Multiple Linear Regression, they use totally different algorithms to create a unique, not necessarily, optimal model. But when the method is random search powered by evolution, the difference between Logistic Regression and Regression is practically non-existent in terms of search mechanisms. So, not surprisingly, the fitness functions described above for Logistic Regression, except for a few small differences, are also used in Function Finding and Time Series Prediction:

  • Relative Error with Selection Range
  • Relative Error/Hits
  • Absolute Error with Selection Range
  • Absolute Error/Hits
  • R-square
  • Positive Correlation Coefficient
  • Bounded R-square
  • Bounded Positive Correlation Coefficient
  • Mean Squared Error
  • Root Mean Squared Error
  • Mean Absolute Error
  • Relative Squared Error
  • Root Relative Squared Error
  • Relative Absolute Error
  • Enhanced Mean Squared Error
  • Enhanced Mean Absolute Error
  • Enhanced Relative Squared Error
  • Enhanced Relative Absolute Error

However, the models created are radically different, not because of the search mechanisms but because of the environment, which is a function of not only the predictor variables but also the response variable. Nonetheless, it is worth pointing out that in Regression, the main driving force is some kind of error measure between the model output and the target. And the new Enhanced Fitness Functions series were tailored differently in Regression in order to tip the balance more towards the error measure than the positive correlation. So, these fitness functions might be especially useful in the initial states of evolution to discover new paths in the search landscape and also to get out of local optima on later stages of evolution. Then, using simpler fitness functions, you can further fine-tune your solutions by minimizing the error you are most interested in.


Fitness Functions for Logic Synthesis

In Logic all inputs and outputs (both the model output and the target) are binary. So the idea of margins doesn't apply here: we only have correct and wrong classifications and the usual four different kinds of classifications also found in Classification. So the new fitness functions of Logic Synthesis reflect these constraints. For instance, the new R-square Fitness Function of Logic Synthesis considers only the positive correlations between the model output and the target. And the enhanced series of fitness functions in Logic, are in this case, enhanced by a reward/punishment component instead of the bounded positive correlation of their Classification counterparts.

  • Hits with Reward/Punishment
  • Cost/Gain Matrix
  • Entropy
  • Purity
  • Accuracy
  • Squared Accuracy
  • Sensitivity/Specificity
  • PPV/NPV
  • SSPN
  • Positive Correlation Coefficient
  • Enhanced Correlation Coefficient
  • Enhanced Mean Squared Error
  • Enhanced Mean Absolute Error
  • Enhanced Relative Squared Error
  • Enhanced Relative Absolute Error


Other Improvements and Features

Speed-ups

The speed of the calculations in the History Panel, needed for computing the performance of all the models in the testing dataset, was dramatically improved. Data loading and model evaluation, both in the Results Panel and in the Logistic Regression Analytics window, also benefitted from similar speed-ups.


Decentralized Model Navigation

Now you no longer need to go to the History Panel to change the active model in order to visualize its structure in the Model Panel or analyze its performance in the Results or Predictions Panels. Now you can just scroll through all your models by entering the model ID in the Model Selector control.


Improved Confusion Matrix

A more comprehensive Confusion Matrix, showing both absolute counts and percentages, is now available in the Run Panel for real-time visualization during the design process and also in the Results Panel. We've also added tooltips for helping un-confusing it a bit.


New Defaults for the Genetic Operators

Genetic operators are the unsung heroes of most evolutionary algorithms, but they are nonetheless an important piece of the puzzle. We've only made a slight change in the defaults of the Genetic Operators, but it brought considerable improvements in the efficiency of evolution, giving rise to much larger and richer histories.


Real-time Evaluation of the Correlation Coefficient

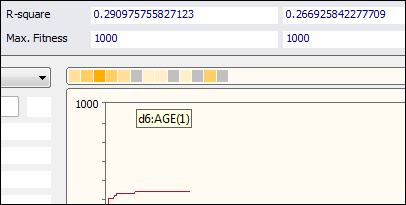
You now have real-time access to the Correlation Coefficient in the Run Panel so that now you can easily identify the positive and negative correlations.


Change Rate Indicator

The Change Rate Indicator was added to the Run Panel for you to evaluate on the fly the speed and efficiency of evolution: the bigger the history the better, which obviously goes hand in hand with shorter periods between changes.


Improved Heatmap

We've improved the colors of the heatmap so that now you can easily distinguish between a much wider range of values for the number of times a variable is being used in the evolving models.


Improved Evolutionary Dynamics Chart

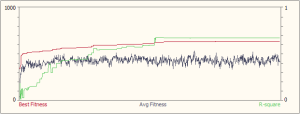
The chart for monitoring the evolutionary dynamics in the Run Panel was extended to support now 1000 generations instead of 500 in the previous versions.


Addition of Neutral Genes

Now GeneXproTools no longer deletes the models in the History after the addition of a neutral gene. Instead, it adds a neutral gene to all the models in the History every time you choose to increase de complexity of your models. Note, however, that if you have histories with lots of models in them, this process will take some time to complete.


New Selection Tools for the Function Set

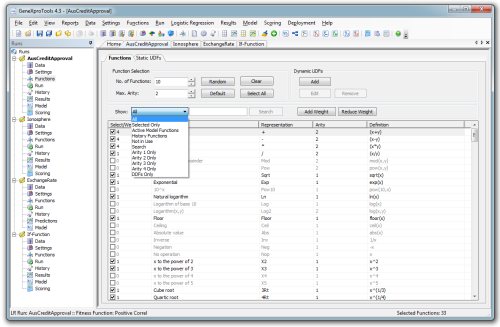
In the Functions Panel we introduced new options for showing the functions that are being used by all the models in the run histories (show History Functions option) and the functions used by the active model (show Active Model Functions option). Also useful is the option of showing the functions that are not at all in use (show Not In Use option), so now you have more access to useful information to help you design more effective function sets.


Big Function Sets

We've also improved the algorithms for processing big function sets, so now you can quickly experiment with richer function sets, before culling them down with the new function selection tools.


New Sorting Tools in the Results Panel

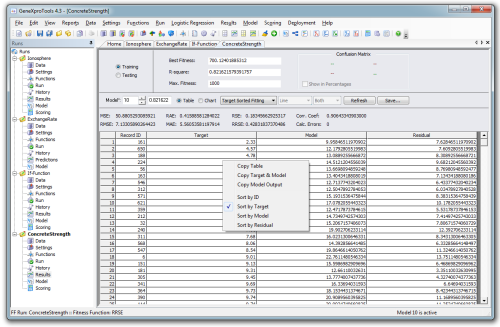
Now the Results Table is indexed and therefore allows for different kinds of sorting. You now can sort your training/testing results by model output, by target or by residual.


New Copy Chart Data

Most charts now have a Copy Chart Data option in the context menu that extracts the exact data being used to create the chart. This is very useful when you need to recreate the chart results and conditions in an external tool such as Excel or other data visualization tool.


New Copy Modes for the Results Table

Now you don't have to copy the entire table all the time: depending on what you need, you can now also copy just the Model & Target or just the Model Output.


New Custom Fitness Functions Examples

Now the Custom Fitness Functions examples in Classification and Logic Synthesis are implementations of the new Hits with Reward/Punishment fitness function of Classification and Logic Synthesis, respectively. Follow the links below to take a look at their JavaScript code:


New UDFs Examples

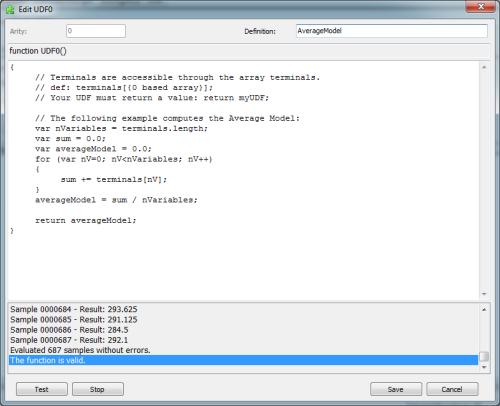
Now more useful examples of UDFs are provided and you can use them straightaway in GeneXproTools. In Classification, Logistic Regression and Function Finding, the Average Model of your data is computed; whereas in Time Series Prediction the Moving Average Model is computed. In Logic Synthesis, an n-Gate NAND is provided as an example.


Sample Runs

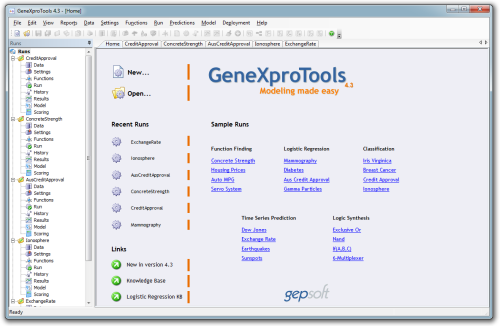
All the Sample Runs in this release are new, even the ones that use the same datasets, to reflect the new defaults and the new spirit of GeneXproTools, which is creating and managing a set of good models. We've also introduced new, more interesting and well-known datasets for you to use as useful benchmarks.


Improved Defaults

We've improved several defaults for things to run even more smoothly:

  • We've increased the number of Random Numerical Constants to 10, as we've discovered a class of problems for which a larger set of RNCs was essential.
  • We now use the same small number of 30 chromosomes for all the problems, as now, with more efficient evolution, a faster pace gives not only excellent results but also a livelier interaction.
  • In Time Series Prediction we've changed slightly the Function Set defaults in order to create even more intricate models to avoid autocorrelation.
  • Also to avoid autocorrelation and increase branchiness in the models, we've increased the starting number of genes to 5 in Time Series Prediction.
  • In Logic Synthesis we've changed the Function Set so that now it also includes the NAND gate and the NOR gate.
  • Now all fitness functions with adjustable parameters come with preset defaults to help you make the most of them without the need for understanding their inner workings in all detail. These defaults reset every time you change the fitness function so that you always have a useful starting point.


New Functionality in the History Panel

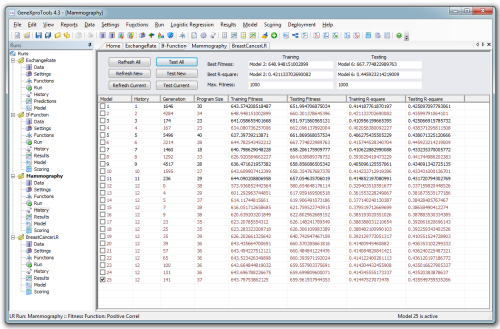
We've added three new buttons in the History Panel to refresh the current model and to refresh and test just the newly added models to the History, a very useful tool when appending multiple histories.


Small Improvement in the Results Panel

Now for fitness functions with outliers/hits counts, we show not only the number of outliers but also the number of hits.


Copy of the Confusion Matrix

Now in version 4.3 you can also copy the Confusion Matrix through the context menu. The Confusion Matrix is shown in the Results Panel for both Classification and Logic Synthesis and you can copy it, either in raw count format or in percentages.


Wheel-Scrolling Capabilities

We've implemented wheel-scrolling in all the tables of GeneXproTools. It was also implemented in the Model Panel for quicker visualization of longer codes.


Scoring Models in Excel

By making the most of the new capabilities for deploying individual models or model ensembles to Excel, if you wish you can now score your models in Excel too.


Support for Excel 2007 and 2010

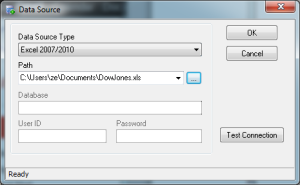
We’ve added support for Excel 2007 and 2010 in the data entry screens. This support, together with improvements in the data loading speed and management, simplifies loading data from most spread sheets.


Improvements in Data Loading in Excel

When loading data from Excel files, GeneXproTools identifies automatically any worksheet with the word "train" or "test" and matches them with the corresponding dataset to speed up the loading process. Additionally, the Excel columns are now loaded in the original order.


Drag and Drop of GEP Files

We've added the capability to load multiple gep files at once using drag and drop. Now you just have to select the gep files in Windows Explorer and drag and drop them in the tree area of GeneXproTools.


Size of GEP Files

We’ve reduced considerably the size of gep files to deal with the new richer histories of version 4.3.

Logistic Regression & Classification with GeneXproTools 4.3


This video shows how to do Logistic Regression and Classification in GeneXproTools, focusing on the new features introduced in version 4.3.


Release Date: November 30, 2011


 Time Limited Trial

 Try GeneXproTools for free for 30 days!

 Read more...

   Academic Editions

Academic licenses of all GeneXproTools editions are available at a discount for education institutions & students.

   Software Bundles

Bundles of GeneXproTools & GeneXproServer are available at a discount price for all editions of GeneXproTools, including academic editions.

   Subscribe to the GEP-List

3 8 4
   

"Finally, a world class user interface in the field of genetic programming and evolutionary computation !! GeneXproTools is simply unrivaled in its marvelous user interface, the breadth of its Fitness Functions, the choice and flexibility in Math and Logic functions, the clarity of its final Model Presentation, and a built in panel for Scoring new data, right inside the interface. This kind of functionality and ease of use has never been seen before in the field of Genetic Programming. Additionally, Dr Ferreira's specific methodology of Gene Expression Programming makes important contributions to the field of evolutionary computation, and the various algorithms she has developed and deployed inside of GeneXproTools are brilliantly conceived, and her methodologies evolve highly predictive models that solve real business problems. GeneXproTools is an extraordinary structural tour de force."

Brian C. Watt, CRM
Chief Risk Officer / Chief Financial Officer
GECC Inc, USA


"I have been using GeneXproTools against a variety of drug research related problems and have found the GUI to be readily-usable and well-attuned to the stages of predictive modeling..."

Steven J Barrett, Ph.D
Principal Scientist
New Applications Team
Data Exploration Sciences GlaxoSmithKline


"Gene Expression Programming, combined with GeneXproTools, allow us here at Mercator GeoSystems to explore new and exciting methods for spatially modelling the relationship between a company's outlets and their customers. The GeneXproTools software is simple to use, well-designed and very flexible. In particular the ability to load training data from a database, and the option to create models in the programming language of our choice, really make this product stand out. Product support is excellent and very responsive - heartily recommended!"

Steve Hall
Mercator GeoSystems Ltd
United Kingdom

"As a professional software developer, I could have attempted to read up on all the latest developments in the field of evolutionary programming and start writing my own modeling tools. One look at the GeneXproTools demo, however, was enough to convince me of the absurdity of that thought. Not only does GeneXproTools have all the power that I would ever need, but it also allows me to customize all parts of the modeling process. I don't have to know the first thing about evolutionary algorithms and yet I can write my own grammars or fitness functions if I wanted to. It is obvious that a huge amount of work went into the making of GeneXproTools, and I am now a very happy customer. Keep up the great work, Gepsoft!"

Glenn Lewis
Software developer, USA

"I've been working as a coastal engineer and mathematical modeler for more than 10 years and now I'm using GeneXproTools to discover complex nonlinear relations that exist in hydraulic and wave processes. For example, GeneXproTools recently helped me establish several explicit approximations to the Wave Dispersion Equation and now with the new version, which allows more independent variables, fitness functions and unlimited records, I plan to develop my own formulae to evaluate the wave overtopping of breakwaters and seawalls. Thanks Gepsoft for providing such an exciting, creative and useful software tool to the scientific community."

Ricardo Carvalho
PROMAN - Centro de Estudos & Projectos, SA
Lisbon, Portugal

"GeneXproTools is being used to look at problems involving parasite populations, where the data is highly skewed. The results using GeneXproTools are considerably better than those obtained using conventional statistics."

Prof John Barrett
Head of the Parasitology Group
University of Wales, UK

"We are using GeneXproTools for modeling the rainfall-runoff process and time series forecasting. GeneXproTools has a nice graphical user interface system and a lot of flexibility in choosing the type of input file. Configuring the problem setup, running and visualizing the graphical outputs with GeneXproTools is indeed user friendly. Being able to get the final model in the languages of our choice makes GeneXproTools stand out from other packages."

Professor S. Mohan
Professor & Head of the Department
Department of Civil Engineering
Indian Institute of Technology, Madras
More


Home | What's New | Products | Buy Now | Downloads | Quick Tour | Support | Contact Us | About Gepsoft | Sign Up
Forum | Blog | Videos | Tutorials | Knowledge Base | Server KB | Logistic Regression Guide | Terms of Use | Privacy & Cookies


Copyright (c) 2000-2023 Gepsoft Ltd. All rights reserved.